A career in fundraising is essentially an ever-growing series of interactions. What’s more, with every email sent, conversation had, and cheque cashed, a fundraiser becomes more knowledgeable, confident, and valuable to their organization.
Ultimately, throughout a career of missteps and successes, fundraisers pick up the skills and experiences that make them an invaluable part of advancing their organization’s mission.
But, what if this process could be sped up? What if the instincts and insights gained from a week, year, or even a career in fundraising could be recorded and analyzed in real-time and communicated effectively to a fundraiser just starting out?
This is possible with data science.
By taking advantage of data science techniques, fundraisers can keep better track of their donor, campaign, and management data to reach conclusions that would otherwise take them years to come to on their own.
So, I’m going to walk you through the basics of data science and share tips on how to get started.
What is Data Science?
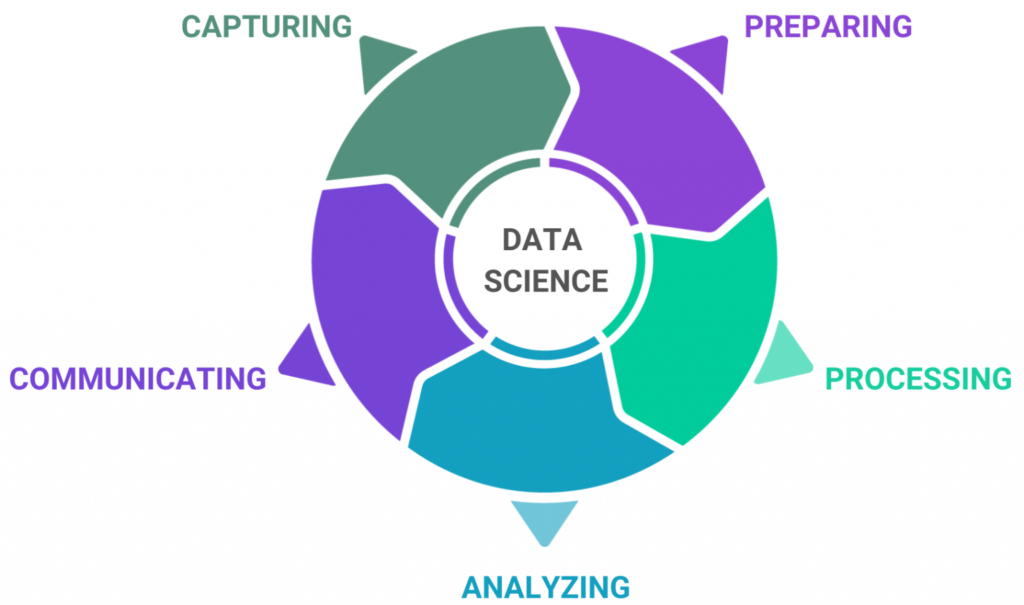
Data science is an approach to extracting actionable insights from the large and ever-increasing volume of data created by today’s organizations. As a fundraising practitioner, think of data science as a cycle rather than an abstract concept.
The Data Science Cycle

- Capturing: Whether you’re manually entering costs into a spreadsheet, writing donor notes in a journal, or sitting back as your CRM does it all for you, the first thing you need to do is start collecting data. A data point can be anything from donation amount to an email sent, or even what you had for lunch! Think about what data points are most relevant to your fundraisings practices and start recording them.
- Preparing: Once data is collected, it’s crucial to make sure that it’s consistently formatted so when it comes time to draw conclusions, you’re comparing apples to apples. This stage of the cycle also includes removing duplicates and finding a reliable data storage tool.
- Processing: After your data points have been trimmed, washed, and stored securely, it’s time to take a step back and think about if you have a sample that’s fit for analysis. At this stage, fundraisers should reflect on their biases that may have affected the data collection. Additionally, the data should be examined to see if the data’s patterns, ranges, and distributions compose a reliable base to draw insights and predictions.
- Analyzing: This is where the magic happens! You, your data scientist, or your CRM will perform statistical analysis to extract insights and predictions from your processed data set. Analysis can take many forms, such as predictive analytics, regression modelling, and can even be embedded in machine learning algorithms.
- Communicating: Finally, your findings need to be translated in a way that stakeholders can understand. Display your analysis in easy-to-read charts, reports, and graphics to display your fundraising success or whatever you choose to collect data on.
For most fundraising shops, data science won’t be performed at the same level it is within major companies. However, even serving on a smaller scale, the benefits of data science for fundraisers can be significant. Let’s dive into some of those benefits right now.
The Benefits of Data Science for Fundraisers
1. Create Fundraising Segmentation
There are several ways fundraisers can make use of data science in their work. However, for the sake of brevity, I’m going to focus on donor segmentation: an application of data science that’s highly effective and relatively easy to implement.
Segmentation is the process of dividing your donors or contacts into groups (or “segments”) based on demographic characteristics, behaviors, or any other variable you choose. The goal is to provide each segment with an appeal that’s personalized to their specific characteristics.
Start Segmenting Your Donors
Use this FREE Donor Segmentation Template to segment your donors and contacts based on their level of engagement.
Personalized messaging works! A study recently showed that emails with personalized subject lines are 26% more likely to be opened!
For example, let’s say you segmented your donors based on giving level during an email campaign. One of your segments consisted of your top email donors. This segment would receive messaging that praises them for their generosity and asks them for a large donation similar to their past contributions. However, if this email was sent to all your contacts, the messaging could confuse and alienate a common donor who can’t contribute a large donation.
Ultimately, segmentation ensures you maximize the individual giving potential of each contact group while providing them with a more personalized giving experience.
Importantly, your donor segments provide you with an excellent platform for data experimentation. By sending different appeals to specific segments and monitoring engagement levels, you engage in a data science cycle of your own. Try to compare each campaign to the last to determine what does and doesn’t work for your organization.
2. Develop Detailed Fundraising Campaign Reports
The Muttart Foundation found that 74% of individuals say they want more information on the actual impact of charities.
Creating easy-to-understand data-driven reports for your stakeholders is an easy way to satisfy this demand. In addition, through effective reporting, nonprofits can operate transparently while demonstrating that they’re holding themselves accountable to the needs of their beneficiaries.
However, communicating impact isn’t always easy. It’s hard to generate relevant findings and demonstrate those findings in a report. Frequently the true impact of an organization can get lost in a black and white sea of tables and charts.
But, when you follow the data science cycle closely, communicating impact is made easy. By investing in tools that closely follow the cycle’s stages, you identify the most important variables to your organizational success.
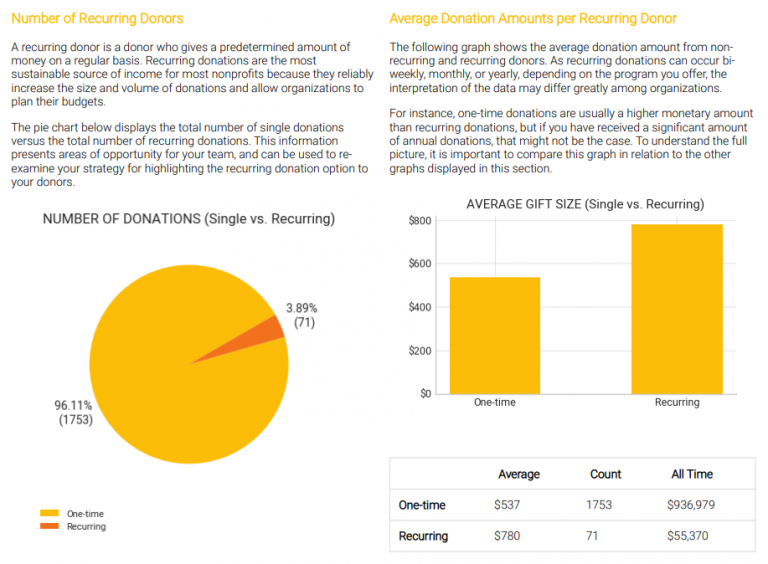
KIT offers visually stunning automated reports that effectively relay fundraising key performance indicator (KPI) progress, revenue forecasts, and other donor insights that detail your impact in a clear and concise document. Designed by leading fundraising consultants, KIT makes it a snap for you to show your board and stakeholders the great work you’ve been doing.

If you’re looking to take your reporting to the next level, book a demo today to learn how KIT can help you visualize your data in just a few clicks.
3. Make Informed Managerial Decisions
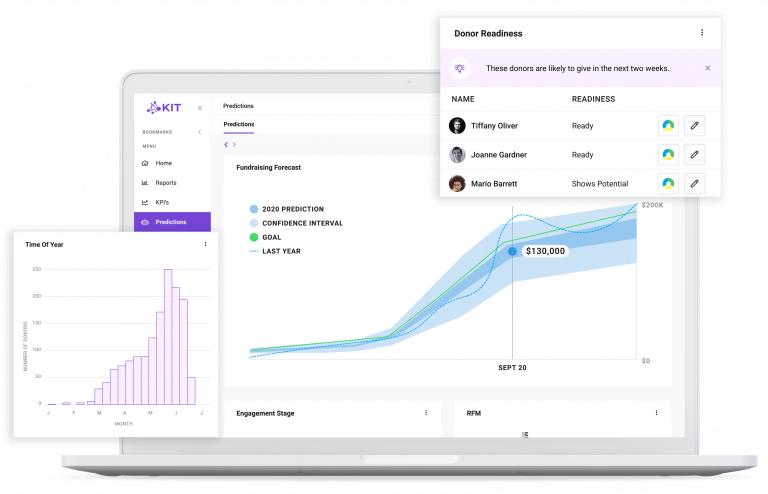
The insights and predictions gained from the data science cycle can also help your board members and directors make accurate organizational decisions. For example, by using predictive analysis techniques, nonprofit fundraisers, executives, and board members can forecast the success of particular campaigns and even revenue growth.

For example, predictive software can make revenue forecasts by considering fundraising trends, strategic goals, and expected performance. These predictions provide nonprofit leaders with the information they need to outline long-term goals for their mission.
Also, for fundraisers, these predictions can serve as a control sample to compare the success of new initiatives. Using your revenue forecast as a baseline for success, every dollar you make above that forecast potentially represents an improvement in your fundraising strategies. Yes, you can even use forecasting to show your boss why you deserve a raise!
3 Ways To Get Started With Data Science
1. Buy a CRM
By far, the easiest way to start taking data seriously within your shop is by finding the customer relationship management (CRM) system that’s right for you. To find the perfect tool for your organization, check out Keela’s buyer’s guide for nonprofit CRMs.
Once you have your CRM, you’ll be able to collect, prepare, process, analyze and communicate data without having to enter data into a spreadsheet manually. So, if you’re not ready to move on from your current CRM but are looking for a more data-driven management system, KIT is perfect for you.
KIT integrates seemingly with your existing CRM to provide you with advanced insights and robust predictions in real-time. Best of all, you can access these features with only a few clicks.
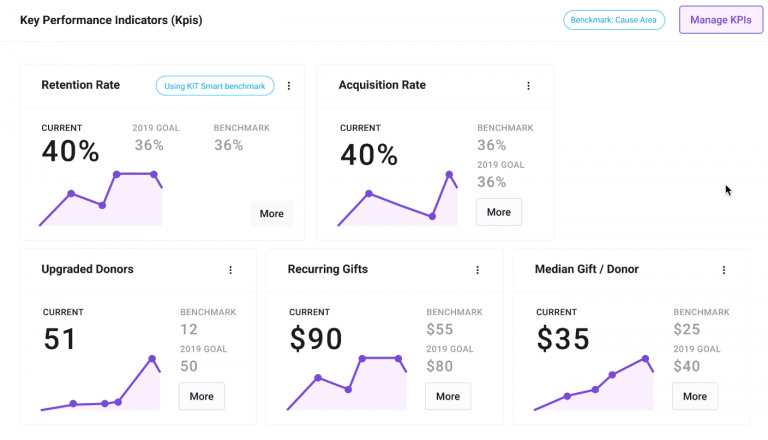
A great example of this is KIT’s KPI dashboard.

With tools like Fundraising KIT, you can track your fundraising and organizational progress all in one system, saving you time and providing you with insights to help you raise more money.
2. Get A Data Scientist On Your Board
You don’t have to make a $100,000 dent in your payroll to bring data science expertise to your organization. One way to gain this expertise while developing a top-down data-focused culture is by bringing a data scientist onto your board.
The Taproot Foundation and Board Source provide a host of resources that will help you find candidates with the right experience for your organization. Also, before you make a hard commitment to any individual, consider asking a prospective board member to join a data analysis special committee or task force. This way, you can decide whether or not the prospect is a good fit for your organization.
3. Host a Hackathon
This is a more complicated way to integrate data science into your organization. However, when successful, hackathons are a fun way to solve significant organizational problems and make relationships with data-driven minds.
So, what is a hackathon?
Essentially, hackathons are marathon-styled events where groups of people come together or compete to solve emergent problems. These events typically bring together people in the tech world, such as programmers and developers, to focus on building functioning applications or programs to solve the problem at hand.
For example, in 2015, a winning hackathon team in Waterloo, Canada, drew upon publicly available city data to create an application that provides citizens with the ability to manage the growth and health of the city’s 30,000 trees. Developed in 36 hours, the app allows users to report distressed trees, identify types of trees, and delineate the difference between publicly owned trees and privately owned trees.
This solution is a bit of a niche example, but it provides insight into the type of functional, data-driven solutions generated from a hackathon.
Additionally, hackathons can take many different shapes and sizes and focus on a range of issues. I would recommend focusing on a problem with a solution, like the app developed in Waterloo, that will provide you with a lasting platform from which to draw on.
If you’re thinking about hosting a hackathon, check out GIVEWP’s nonprofit hackathon guide for more information on what you’ll need to prepare.
4. Find A Consultant
Working with a consultant is also a great way to get your organization started with data science. Without making a long-term investment, you can rely on a consultant to help you understand data collection, preparation, analysis, and visualization.
For example, DataViz For Nonprofits provides high-quality visualizations that can help your organization better understand its data and show its impact. Their website offers a host of visualization examples for nonprofits.
Additionally, Community Dataroots can help you get your data ready for analysis. This company will take you through data cleansing, standardization, and enrichment so you can have the most accurate samples to draw on for your next campaign.
Overall, consultants can provide a fast and low-commitment solution to nonprofit data roadblocks.
“Data science” is a daunting phrase to hear. It’s made up of two words (“data” and “science”) that give us flashbacks to our least favorite high school subjects. . . well, they were my least favorite anyway.
However, becoming a data-driven nonprofit organization doesn’t have to be expensive or time-consuming. By learning the basics I’ve outlined and trying out the tools I’ve mentioned, you can become the data scientist you never thought you were.

Jack Showers
Nonprofit Research Analyst at KIT
When Jack isn’t cheering for the Raptors or watching an 80s action movie, he’s studying the social sector and producing content for nonprofit professionals. As a Nonprofit Research Analyst at KIT, an AI-powered insights and reporting toolkit, he is especially passionate about helping fundraisers save time and raise more money for their cause.


