

Fundraisers must analyze their campaigns and appeals from all angles to understand if their work is truly successful.
What’s more, as fundraisers prioritize activities like talking to donors and planning campaigns, they can’t always find time to choose the correct fundraising analysis techniques and make the necessary calculations.
With that in mind, I have compiled and explained six fundraising analysis techniques to help you gain a holistic view of your work:
Within each section, I’ll cover how to perform each analysis, implement them practically, and improve your fundraising using them.
While these techniques aren’t the only types of analysis you should perform, they will provide you with a thorough understanding of your fundraising performance.
6 Fundraising Analysis Techniques to Keep In Mind
1. SWOT Analysis
First, let’s look at a well-known analysis method that’ll help you map out your fundraising environment: SWOT Analysis.
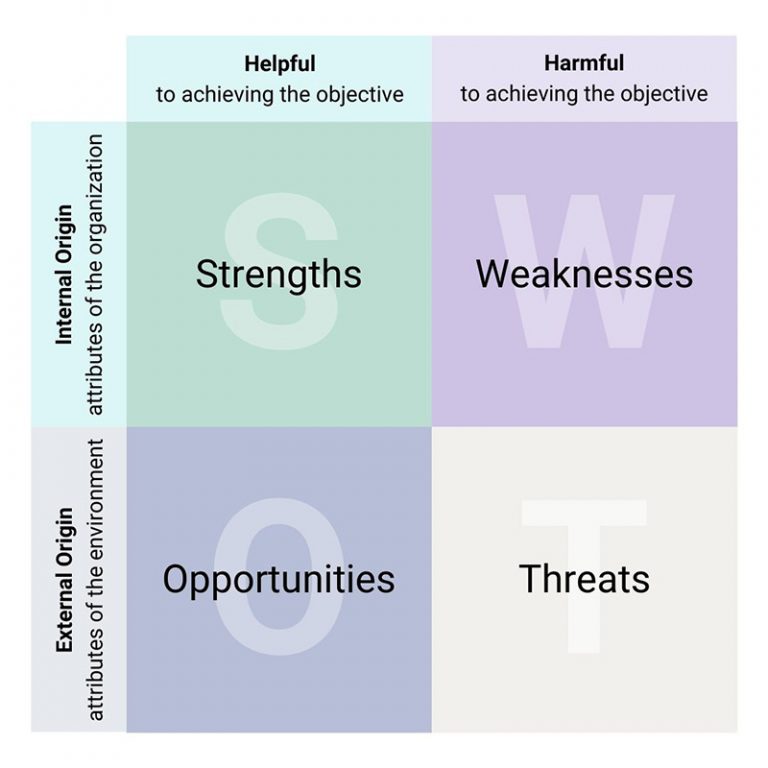
This simple technique prompts you to examine your nonprofit’s strengths, weaknesses, opportunities, and threats. By examining these factors, you’ll understand what to account for while designing and executing your fundraising strategy.
However, before continuing, I will briefly define each of these factors.
- Strengths: These are things your organization is good at. Think about the internal advantages you have over similar organizations like a large prospect pool, highly skilled volunteers, or highly passionate major donors.
- Weaknesses: Think about what your organization isn’t so good at relative to similar organizations. Consider things like high donor turnover, poor marketing, or a lack of technical expertise.
- Opportunities: What opportunities, situations, or practices has your organization yet to take advantage of? Opportunities can be untapped volunteer communities, specific major donor prospects, or new grant applications.
- Threats: We all have negative external forces we can’t control; these are your threats. Threats include unfavorable changes to laws or regulations, economic recessions, rising taxes, or even operating in a low population area.
Remember that strengths and weaknesses occur internally, and opportunities and threats occur externally.
Monitor Your Fundraising Performance with this FREE Dashboard
Use this template to record your fundraising metrics so you can better communicate your progress with your team.
How to Use Your Nonprofit’s SWOT Analysis
SWOT analysis may not help you understand why specific campaigns or appeals are successful, and others aren’t. But, it will give you a detailed context to analyze other metrics within.
For example, let’s say you work for an organization with a fantastic website and strong digital marketing strategy—and that’s one of your nonprofit’s strengths. If your organization receives a disproportionately high rate of smaller online donations; consequently, your Average Donation Amount (ADA) will be lower than similar organizations.
So, if you only looked at your ADA metric, you’d think there was something wrong with your fundraising strategy. However, after thinking about your organization’s strengths, you’ll realize that while online donations bring ADA down, the success of your online fundraising dramatically improves your overall revenue.
To get the big picture of your nonprofit’s fundraising performance, you should conduct a detailed SWOT analysis.
You can get started using this checklist:
- Get your team involved
- Use large visuals (chart paper, chalkboard, projector, etc.)
- Explore the context of each point raised
- Compare to similar organizations
- Support each point with data
- Keep a digital copy
- Review the analysis with external stakeholders
- Review the analysis frequently and revise when appropriate
Ultimately, a thorough SWOT analysis will provide you with a better understanding of your working environment. It’ll help you assess fundraising metrics with the background information needed to predict why success or failure occurs in certain areas.
2. Donor Acquisition Rate
Within a nonprofit, there’s constant donor churn, pledge unfulfillment, and change in revenue growth. These factors necessitate the need to acquire new donors constantly. The next metric I’ll cover, Donor Acquisition Rate, measures an organization’s ability to do just that.
How to Calculate Donor Acquisition Rate
Donor Acquisition Rate is the percentage of your total donors first acquired in a period of your choice (monthly, quarterly, annually, etc.).
As an example, here’s the formula for the monthly donor acquisition rate.
# of First Time Donors This Month ÷ Total # of Donors = Donor Acquisition Rate
10 ÷ 1000 = Donor Acquisition Rate
Donor Acquisition Rate = 1%
How to Use Donor Acquisition Rate
Each organization will have a different rate depending on the makeup of its donor base. The most important thing to keep in mind is that your Donor Acquisition Rate should at least make up for the donor turnover rate. Some turnover is inevitable, but your organization will not survive if you’re losing more donors than you’re acquiring.
Ideally, your Donor Acquisition Rate should increase each month subtly as you refine your methods.
How to Increase Donor Acquisition Rate
It can be challenging to find new donors, especially if you feel like you’ve reached your donors’ philanthropic potential. Luckily, communities are no longer defined solely by geographic limits. So, take advantage of the internet community at your fingertips!
Increasing your nonprofit website’s organic traffic and main page conversion rate is an effective way to establish a more efficient form of donor acquisition.
Your web traffic is made up of visitors who came across your website because it popped up in their Google Search returns. The best way to improve your organic traffic rate (Sector Benchmark: 42%) is by starting a blog.
On your blog, publish impact stories and encourage guest authors to write about topics related to your cause. For more information on boosting your organic traffic, check out this SEM Rush’s article on five ways to improve nonprofit search engine optimization (SEO).
Once you have more website visitors, you’ll need to increase your Main Page Conversion Rate (Sector Benchmark: 21%) to boost donations. The focal point of your conversion strategy will be the donate button in the top right corner of your website.
While you probably already have a button, you may not be getting the most out of it. Read Keela’s blog on how to optimize your donate button to attract new donors and increase your Donor Acquisition Rate.
Start Segmenting Your Donors
Use this FREE Donor Segmentation Template to segment your donors and contacts based on their level of engagement.
3. Donor Churn Rate
If Donor Acquisition Rate analyzes success at the beginning of your fundraising funnel, Donor Churn Rate measures success (or failure) at the end of your funnel.
For example, donor Churn Rate calculates the percentage of donors who have not given to your organization again for more than a year.
A Comprehensive Fundraising Assessment Guide for Nonprofits
Donor Acquisition Rate is the percentage of your total donors first acquired in a period of your choice (monthly, quarterly, annually, etc.).
As an example, here’s the formula for the monthly donor acquisition rate.
# of First Time Donors This Month ÷ Total # of Donors = Donor Acquisition Rate
10 ÷ 1000 = Donor Acquisition Rate
Donor Acquisition Rate = 1%
How to Use Donor Churn Rate
Fundraising efforts have often been referred to as a leaky bucket: as you fill your “bucket” with donors, some will inevitably leak out (churn). However, effective stewardship can mitigate the leakage and reduce donor churn.
Ultimately, Donor Churn Rate is an indicator of how successful your stewardship activities are. If this metric goes down as you implement new stewardship initiatives, your efforts are likely working.
Also, don’t forget to consider global and seasonal trends. During recessions, donors may not give, but don’t give up on them, and consider making an ask again the following year.
How to Decrease Donor Churn Rate
As hinted above, the best way to decrease donor churn is to improve your stewardship mechanisms.
The first step in enhancing stewardship is to take a look at your overall stewardship strategy. Then, ensure you’re taking reasonable steps to thank, communicate impact, and share successes with donors at all giving levels.
Also, examine previously churned donors and establish similarities between them. If any demographic, donation, or communication patterns link your churned donors, think of ways to make those donors feel more connected to your cause following future gifts.
Keep in mind that you’re significantly improving your fundraising even if you decrease annual churn by 5%. Of course, you’ll never be able to eliminate churn; this is why it’s so essential to strengthen donor retention and acquisition together.
4. Fundraising Overhead Percentage
Using predictive analysis techniques, KIT helps you understand your donors better so you can connect with them better and reduce your donor churn rate.
How to Calculate Fundraising Overhead Percentage
Fundraising Overhead Percentage measures the actual profit generated from fundraising efforts. An example formula is below.
(Total Fundraising Expenses ÷ Total Amount Raised This Year) x 100 = Fundraising Overhead Percentage
($238,000 ÷ $1,088,000) x 100 = Fundraising Overhead Percentage
Fundraising Overhead = 21.87%
How to Use Fundraising Overhead Percentage
There’s no “correct” or exact overhead percentage nonprofits should aim for. Because every nonprofit, fundraising department and donor base is different, every percentage should be unique to its organization.
The most important thing to consider when studying your overhead is the difference between efficiency and effectiveness. Your fundraising overhead percentage will give you an idea of how efficient your fundraising is. However, this percentage doesn’t take into account how effective your fundraising is.
Let’s exemplify this consideration with a question: would you rather raise $750,000 with an overhead of 28%? Or, would you rather $2,000,000 with an overhead of 43%?
Even though you’d raise the $750,000 more efficiently, it would be more effective for your organization to raise the $2,000,000. Ultimately, you would end up banking $1,114,000 of the $2,000,000 but only $540,000 of the $750,000. So, don’t lose sight of effectiveness when considering efficiency!
How to Reduce Your Nonprofit’s Fundraising Overhead
Here are five factors to consider when deciding the overhead percentage that’s right for you.
- Your Board of Directors: Consult your board for the percentage your organization should aim for. Additionally, have them read Goggins Greggory and Howard’s article titled The Nonprofit Starvation Cycle. This article discusses the dangers of having too low of an overhead and should educate your board on the need to invest sustainably in your nonprofit’s overhead.
- Your Stakeholders: Stakeholders must feel that you’re handling finances in a way that best serves them. So, ensure that you incorporate their input into your financial management strategy. Also, transparency and accountability efforts must be maintained to live up to your stakeholders’ needs and educate them on the benefits of operating with your current overhead.
- Accreditation: Organizations like the Better Business Bureau and Imagine Canada require registered charities to spend a justifiable amount on administration and fundraising to receive accreditation. If you’re seeking third-party accreditation, review their overhead standards before applying.
- Diminishing Returns: If you can, experiment with your fundraising expenditures to find where your organization’s point of diminishing returns is. Ask yourself, “at what point does our fundraising begin to take away from our mission?”. No matter how much money a nonprofit can make, they can never afford to prioritize fundraising over their mission.
- Five-Year Average: Some years, you may secure a major donation that decreases your overhead percentage significantly. In other years, you may be unlucky and have a high percentage. Consider calculating a five-year average to account for this volatility.
5. Dependency Quotient
A financially successful nonprofit isn’t necessarily a financially sustainable nonprofit.
For example, if 90% of your funding comes from only 5% of your donors, and those donors stop giving, you’ll likely be consumed by your organizational costs before you know it.
This is why it’s crucial to understand if you’re overly dependent on too few donors by calculating your dependency quotient.
The Pareto Principle, a popular concept in the nonprofit sector, states that 80% of your organizational revenue is likely to come from 20% of your donors if you’re securing major gifts and bequests properly. Using this principle as a benchmark for success, I’ll provide an example of a dependency quotient calculation.
How to Calculate Dependency Quotient
To start, you’ll need a range of each of your donors’ total contributions for a given period. For this example, we will take the total donations made from 20 donors for a calendar year and follow the steps below to find out our dependency quotient.
- Sort your donor’s contributions from highest to lowest.
$10, $15, $18, $26, $51, $61, $68, $72, $90, $101, $120, $154, $159, $168, $201, $217, $832, $1645, $1958, $2379.
2. Add up the total value of the contributions.
Total amount of donations = 8,345
3. Calculate 80% of your total donations.
80% of total donations = .80 x 8,345
6,676 = 80% of total donations
4. Starting with the highest donor contribution, add up the contributions in descending order until you get a value equal to or greater than 80% of your total donations (in this case, 6,676).
$10, $15, $18, $26, $51, $61, $68, $72, $90, $101, $120, $154, $159, $168, $201, $217, $832, $1645, $1958, $2379.
2379 + 1958 + 1645 + 832 = 6814
In this example, the first four donor contributions add up to 6814, an amount greater than 80% of total donations.
5. Find out the percentage of your donors that donated $6,814.
(Top 4 donors ÷ 20 total donors) x 100 = percentage who donated $6,814
Percentage who donated $6,814 = 20%
6. Because the amount given by your top donors ($6,814) is slightly higher than precisely 80% of total donations ($6,676), you have to find the actual percentage. To do this, divide your top donors’ donations by total donations.
(6814 ÷ 8,345) x 100 = percent contribution of 80th percentile donors
Percent contribution of 80th percentile donors = 81.65%
From this calculation, we know our organization is dependent on 20% of our donors to provide about 82% of our total fundraising revenue. This finding aligns nicely with the Pareto Principle and means our hypothetical organization is likely focusing enough attention on major gifts and bequests relative to other appeals.
Keep in mind that this is a theoretical sample with a purposely small amount of donors and total donations. In practice, this calculation would need to be made within a spreadsheet or CRM to manage a more extensive data set.
How to Manage Dependency Quotient
At its extremes, the Dependency Quotient is typically an indicator of one of two things.
First, if your quotient is too polarized, let’s say 90% of your donations come from 5% of your donors, you may have to invest more resources in low-level and mid-level giving programs. If this is the case, consider setting up a peer-to-peer giving (P2P) campaign.
P2Ps can be great ways to increase mid-level giving while also empowering your current donors and making connections within their networks.
Second, if your quotient is more unified, let’s say 60% of your donations come from 40% of your donors, you may need to invest more resources in your major gifts and bequests solicitations.
One way to improve your major gifts strategy is by using prospect research tools like iWave or DonorSearch that help you find prospects with the capacity, linkage, and inclination necessary to provide your organization with a major gift.
6. Recurring Donations Growth Rate
The average retention rate of a repeat donor is approximately 33% higher than a first-time donor. Essentially, donors who contribute a second gift are much more likely to give again than first-time, or one-time, donors.
Moreover, recurring donors provide nonprofits with the financial stability needed to pursue their mission, calculate revenue forecasts, and make critical organizational decisions.
Nonprofits should ensure they have a reliable income stream from monthly donors and a steady increase in recurring gifts over time. This increase will hopefully account for any monthly donor turnover.
How to Calculate Recurring Donations Growth Rate
Calculating Recurring Donations Growth Rate is relatively simple and will allow you to observe changes in recurring gifts over the timespan of your choice. Below is an example of a monthly growth rate calculation.
([This Month’s Rec. Donation Amount – Last Month’s Rec. Donation Amount] ÷ Last Month’s Recurring Donation Amount)) x 100 = Monthly Recurring Donations Growth Rate
([$10,000 – $9,500] ÷ $9,500)) x 100 = Monthly Recurring Donations Growth Rate
Monthly Recurring Donations Growth Rate = 5.26%
How to Use Recurring Donations Growth Rate
Essentially, you only need to worry if your growth rate is too low. But how low is too low? In their KPI toolkit, Keela reported that the benchmark for their CRM users was about 10% monthly growth.
How to Increase Recurring Donations Growth Rate
My calculation indicates that our hypothetical nonprofit saw about a 5% increase in recurring donations this month. So, although it’s good news the organization saw an increase in monthly recurring donations, 5% is actually below the 10% benchmark.
If you find that your organization’s growth rate is also lagging behind the 10% benchmark, try to weave monthly giving appeals into your pre-existing solicitations. Experiment with adding a “monthly” option to your website’s donate button and email appeals. Even better, consider sending your top virtual donors a specialized request, asking them to take the next step in their donor journey.
Also, during face-to-face appeals, tell your donors why recurring gifts can be more impactful for the organization and more manageable for them. For example, a donor may feel they can’t commit to a $100 donation but may happily agree to a $15/month donation that fits more reasonably into their budget.
It’s not enough to analyze your fundraising from a bird’s eye view. To get a clear picture of how well you’re doing, you have to analyze your work from multiple angles. From these angles, you may start to see the cracks in your fundraising strategy.
However, don’t let flaws discourage you! On the contrary, you should be as excited to find your weaknesses as you are to experience successes because flaws represent a new opportunity for growth and an avenue to advance your mission.

Jack Showers
Nonprofit Research Analyst at KIT
When Jack isn’t cheering for the Raptors or watching an 80s action movie, he’s studying the social sector and producing content for nonprofit professionals. As a Nonprofit Research Analyst at KIT, an AI-powered insights and reporting toolkit, he is especially passionate about helping fundraisers save time and raise more money for their cause.


4 Comments