

You’ve probably heard of the fundraising funnel before.
If not, I’m sure you’ve heard of similar concepts like the “donation pyramid,” “sales funnel,” or “nonprofit marketing funnel.” Although slightly different, these concepts can all be used to better understand the success of your fundraising strategy.
Each concept serves the ultimate purpose of helping fundraisers turn prospects into long-term donors. The fundraising funnel presented in this article examines the donor journey, going from prospect to repeat donor.
Studying each stage of the funnel will help you to better understand your fundraising, identify areas for success, and raise more for your cause.
This funnel will predominantly explore the digital donor journey as there’s more benchmark data available for online giving. Most data points have been pulled from M+R Benchmark’s 2022 study that measures online trends in nonprofit communication and giving.
The best way to use this resource is to compare your performance to the sector benchmarks in each section and experiment with the highlighted best practices to make improvements where needed.
Alrighty, let’s get to it!
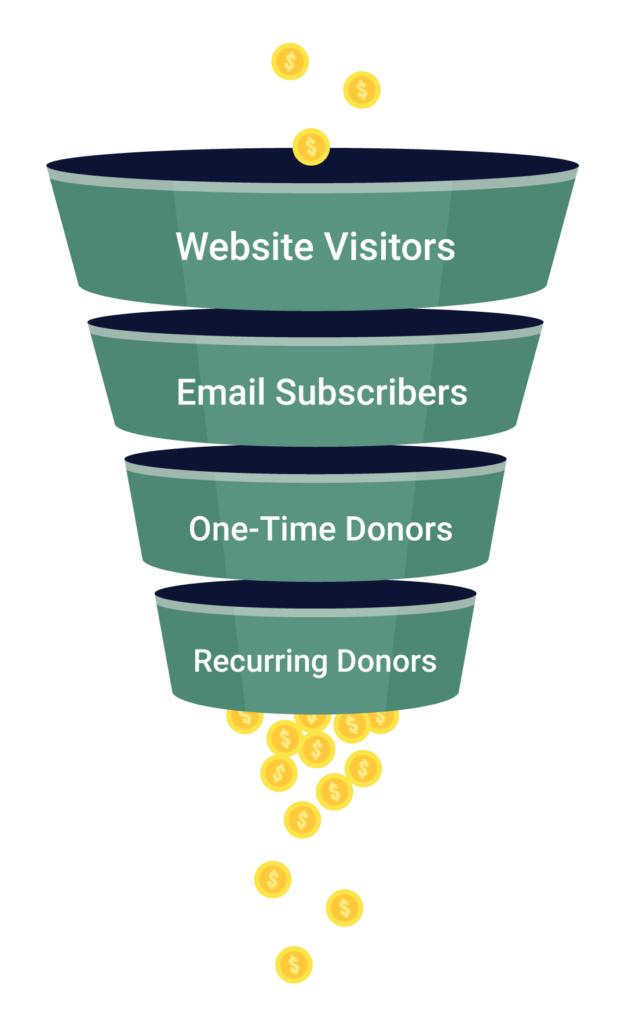
4 Stages of the Fundraising Funnel
1. Website visitors
Total nonprofit online revenue grew by 3% in 2021.
While this increase was partly influenced by the COVID-19 crisis’s displacement of face-to-face giving, online revenue was already steadily increasing, with a 60% increase from 2017 to 2021.
These stats show why it’s crucial to take your nonprofit’s online fundraising seriously. Additionally, you need to have a well-maintained website that’s easy to find, navigate, and donate on so you can diversify your revenue and grow your donor base reliably.
Here are two metrics that are crucial to monitor to improve website performance.
Become a Data-Driven Fundraiser and Raise More for Your Cause
The Certified Data-Driven Fundraiser program is a series of fundraising courses taught by industry-leading experts introducing fundraisers to every component of data-driven fundraising. Advance your career and earn CFRE continuing education credits
a. Organic website traffic rate (benchmark: 41%)
Some prospect donors will stumble onto your website and be swept off their feet by the slick homepage, powerful mission statement, and the beautiful faces on your “Our Staff” page. These folks make up your organic traffic.
Organic traffic is the key to finding new donors online.
For nonprofits, organic traffic makes up 41% of overall traffic. To see how your website stacks up, create a Google Analytics account to see the traffic sources of your website pages.
How to improve your nonprofit’s organic website traffic rate
If you find your organic traffic isn’t quite up to par, start a blog! On your blog, publish impact stories and encourage guest authors to write about topics related to your cause. For more information on boosting your organic traffic, check out SEM Rush’s article on five ways to improve nonprofit search engine optimization (SEO).
b. Main donation page conversion rate (benchmark: 17%)
Once visitors are blown away by your website, to donate, or not to donate, that is the question.
Overall, nonprofits motivated 17% of their main donation page visitors to make a contribution. However, conversion rates vary between types of nonprofits. For example, Hunger/Poverty nonprofits had a conversion rate of 47%. Wow!
How to improve your donation page conversion rate
The focal point of conversion is the donate button. If you find you’re lagging behind your cause area benchmark, follow these five simple best practices:
- Stand out: Ensure your donate button is contrasted from your page’s background, so the eye is easily drawn to it.
- Keep it simple: Avoid complicated graphics or text that may distract from the button.
- Prioritize mobile users: Having a mobile-responsive website is crucial. Mobile visitors account for 54% of traffic, 35% of digital transactions, and 24% of digital revenue.
- Make it obvious: Don’t bury your donation button on a page’s footer. Put it somewhere prominent, like the top right corner.
- Use calls to action: The language used in your button can make all the difference. “DONATE” or “GIVE” may be just what you need to increase your conversion, but it’s worthwhile to experiment. Try active language: help, change, or act. Or, try to add a sense of urgency: now or today.
FamilyPromise provides a great example of a donate button. The button’s placement and color call website visitors to action.
2. Email subscribers
After prospects visit your website, whether they donate or not, they may want to learn more about your organization’s work. Email communications are an excellent way to welcome, update, and nurture prospects.
You’re likely familiar with email metrics from your experience using nonprofit CRMs or email marketing services like MailChimp and SendGrid. Whatever the case may be, there are a few metrics you should pay special attention to so you can increase email engagement and donations.
Monitor Your Fundraising Performance with this FREE Dashboard
Use this template to record your fundraising metrics so you can better communicate your progress with your team.
a. Open rate (benchmark: 23%)
The first metric to study is the open rate, which simply measures the percentage of your email recipient list that opens your emails.
The average nonprofit email open rate across all-cause areas and email types is 23%. When looking at specific email types, the rate for newsletters was 23%, and the rate for fundraising emails was also 23%.
How to improve your open rate
Personalize your emails! Recent studies on personalized messaging revealed that recipients would open and read emails 26% more if they contain relevant and personalized subject lines. It was also found that personalizing your communications can help increase email revenue by a staggering 760%!
b. Click-through rate (benchmark: 0.65% – 1.5%)
Once a supporter opens your email, they should be prompted to take action by reading more on a topic or donating. The percentage of recipients that click on a hyperlink, CTA, or donate button makes up the next metric we’ll look at: click-through rate (CTR).
The average CTR is 1.5% for newsletters and 0.65% for fundraising emails.
How to improve your nonprofit email’s CTR
For emails, timing can be everything. Start by limiting your communications between 10 a.m. and 2 p.m., and experiment with your timing based on engagement.
Also, keep in mind that your donors may be scattered across different time zones. In your CRM or emailing software, segment donor communications based on time zone, and you may see an uptick in engagement.
c. Email list growth & unsubscribe rate (benchmarks: 7% & 1.8%)
Those low CTR percentages should tell you the importance of casting a wide net with email messaging. To maintain the size of your net, you need to steadily increase your email list growth while decreasing unsubscribe rates.
The average list growth for organizations during 2021 was 7%.
How to improve your nonprofit email list growth rate
To maintain list growth, apply the donate button best practices to your website’s “subscribe” button. Additionally, sign donors up for your newsletter following their first donation. If your CRM has email form features, you can do this automatically.
It’s also crucial to minimize your unsubscribe rate: a metric that measures the amount of your list that unsubscribes from email communications. In 2021, nonprofits averaged a 1.8% unsubscribe rate.
How to reduce your unsubscribe rate
Personalizing your email communication to the needs of the individuals on your mailing list is one of the most effective ways to reduce your unsubscribe rate. To personalize your communications, segment your donors and offer them the opportunity to customize what type of emails they receive.
d. Donation Rate (benchmark: 0.05% – 0.29%)
Perhaps the most critical email metric, the donation rate, measures the percentage of your list that donate from an email they receive. For emails sent to established donor audiences, the rate is 0.29%. For prospect audiences, the rate is 0.05%.
How to improve your donation rate
To increase your donation rate, consider setting up an email drip campaign.
Email drips are a tech-enabled strategy that nurtures your audience, keeps them engaged, and drives them to donate. By planning out a series of emails in advance and scheduling them to send automatically, you save time writing emails reactively and on an ad hoc basis.
The marketing blog Pinpointe compiled a long list of statistics on drip emails with some mind-blowing stats:
- Drip campaigns generate 80% more sales but cost one-third less to produce.
- Email open rates are 80% higher for drips over your regular off-the-cuff email.
- Automated marketing resulted in a 451% increase in qualified leads. That’s not a typo. . . 451%!
Keep in mind that you can apply these tips to other email types like advocacy and fundraising campaign emails. Also, schedule emails in advance. This will help you craft your overall strategy, making sure everything ties well together.
3. One-time donors
Once a prospect has visited your website, subscribed to your newsletter, and begun to feel like they’re a part of your mission, they may just choose to donate.
Unfortunately, there isn’t much data on the average first-time gift amount that online fundraisers should expect. However, M+R Benchmarks found that In 2021, the average one-time gift was $125, up from $111 the previous year. As one-time donations are also first-time donations, it isn’t too much of a stretch to assume the amounts would be similar.
How to Secure More First Time Donations
You’ll need to find the right platform to accept donations, preferably one that integrates seamlessly with your website.
The most popular donation platforms for accepting online donations are Paypal and Stripe. Both Paypal and Stripe offer nonprofit discounts and, compared to other payment processors, they make it easier for you to recoup a more significant percentage of your donations.
Additionally, ensure that your CRM integrates with popular donation platforms so you can manage
Download FREE Thank You Letter Templates
Saying “thank you” is a vital part of a nonprofit fundraising strategy. Use these templates to craft general, campaign, and impact-focussed thank you messages.
4. Recurring donors
Monthly giving is becoming an increasingly effective way for nonprofits to develop a reliable stream of online revenue. In 2021, monthly giving increased by 24% and accounted for 22% of all online revenue.
How to Secure More Repeat Donations
To convert more monthly donors it’s important to set up an efficient stewardship plan that relays a donation’s impact back to the donor. One of the best ways to demonstrate impact is through communicating organizational success to donors.
For example, KIT’s Presentation-Ready Report Builder analyzes your data and allows you to build custom reports by selecting metrics, filters, and time frames of your choice. These reports can communicate fundraising efficiency to your most promising donors and help you raise more. Book a demo today to see how KIT can change the way you show impact.
The fundraising funnel is a tool to analyze your digital fundraising strategy and find areas for growth.
Use the featured benchmarks to hone your fundraising strategy, make deeper connections with your donors, and raise more for your cause. Now get out there and raise some money!

Jack Showers
Nonprofit Research Analyst
When Jack isn’t cheering for the Raptors or watching an 80s action movie, he’s studying the social sector and producing content for nonprofit professionals. As a Nonprofit Research Analyst at KIT, an AI-powered insights and reporting toolkit, he is especially passionate about helping fundraisers save time and raise more money for their cause.


Best view i have ever seen !